
Round #31: Evercore: Private Markets in Three Acts
The Central Bank’s rates; Evercore’s Private Market Report; BDCs' Software Exposure; Lincoln on Defaults; Andrew Milgram on Distressed Debt; Deals; Bulletin Board.

In Round #31: Update on the Central Bank’s rates; Insights from Evercore’s private market report; BDCs’ hidden software exposure; Lincoln’s report on defaults; Andrew Milgram’s take on distressed debt; Notable deals; Bulletin Board.
1. Imported Optimism
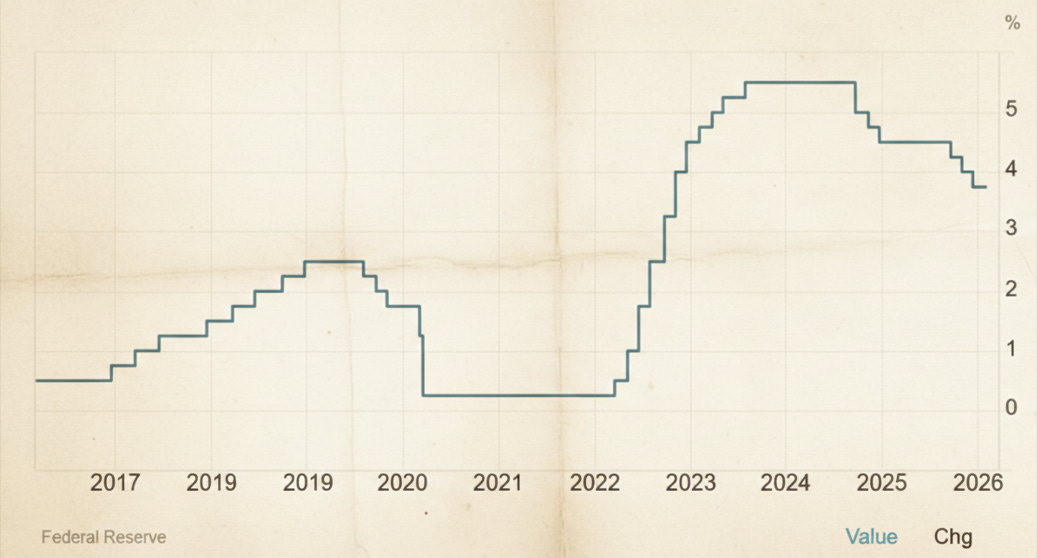
Finally, good news: CBE lowers interest rates for the sixth time in ten months. What is CBE, you might ask? Well, it’s the Central Bank of Egypt.
Listen, I don’t care that it’s CBE or that their rate went from 27% last year to 17.25%. If I need to go to another continent to find positive economic news I can project onto the US and EU markets, I’ll do that.
I also can’t help noticing that Egypt’s inflation chart (below) looks a lot like the Pyramid of Giza. Hopefully that’s not how rate policy gets set, because if they want to “finish the shape,” they’d have to start hiking again.
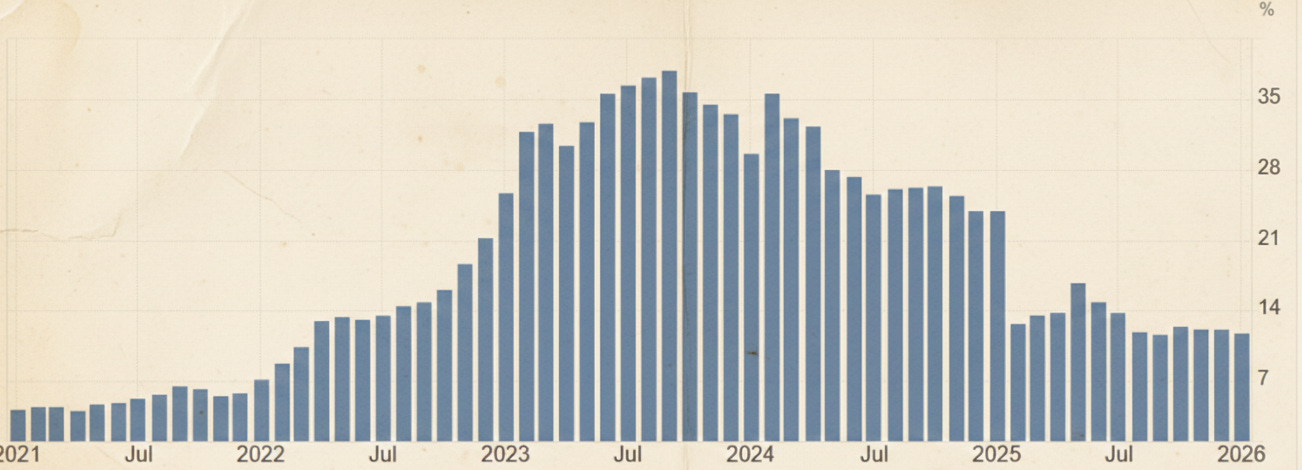
We wouldn’t wish that on anyone!
2. Evercore: Private Markets in Three Acts
You know, I am generally skeptical of the "2026 Forecast" reports circulating online because most were written back in December 2025. It is hard to put much weight on them when the market has shifted so drastically since then, particularly with the Venezuela operation, a new Fed Chair, the recent SaaS sell-down, etc. In fact, I even hesitated to read Evercore’s State of Private Markets 2026 report released a few weeks ago, but eventually gave in. Luckily, it turned out to be less of a forecast and more of a status report. It is a massive 57-page document covering interviews with LPs and GPs who mostly talk their own books to the point of cringe, but there are enough curious data points to warrant a discussion.
Act One
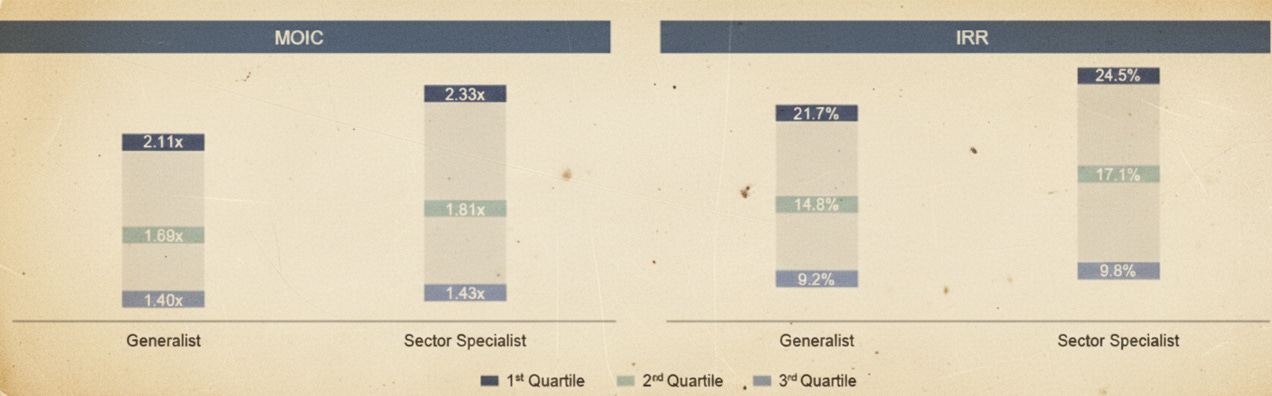
The first such piece comes from Preservation Capital Partners. They make a somewhat obvious observation regarding the commoditization of PE and the need for differentiation. They suggest that specialists have historically outperformed generalists using data from 2006 to 2020, though they note that a simple sector or geographic focus is not enough.
It’s important to focus on the second and third derivatives, in essence, knowing (i) what type of secular trends and business differentiators to look out for, and (ii) how to create value in detail.
And then they talk about the typical value creation playbook of margin improvement, technology enhancement, organic and inorganic growth initiatives.
They follow this by outlining that secular trends require a hyper-focus on thematic investing (research on macro tailwinds, geographic deep-dives, etc.) and the typical value creation playbook (margin improvement, technology enhancement, etc.).
It is hard to disagree with their logic. I have to admit, though, that I was surprised the sector specialist’s MOIC is only 0.22x better than the generalist’s (I won't comment on IRR since that is not a serious metric). When hundreds of millions are at stake, 0.22x clearly makes a difference. However, if you allocated hundreds of millions to large SaaS-focused PEs in 2019 or 2020, your view on those risk-adjusted returns might be shifting right about now, you know?
To continue the PE-differentiation theme, there is a piece by Aware Super (an Australian pension fund) arguing that emerging managers, defined as those in their first few fund vintages, have historically outperformed established players. And of course, they use a chart with my beloved IRR to prove it:
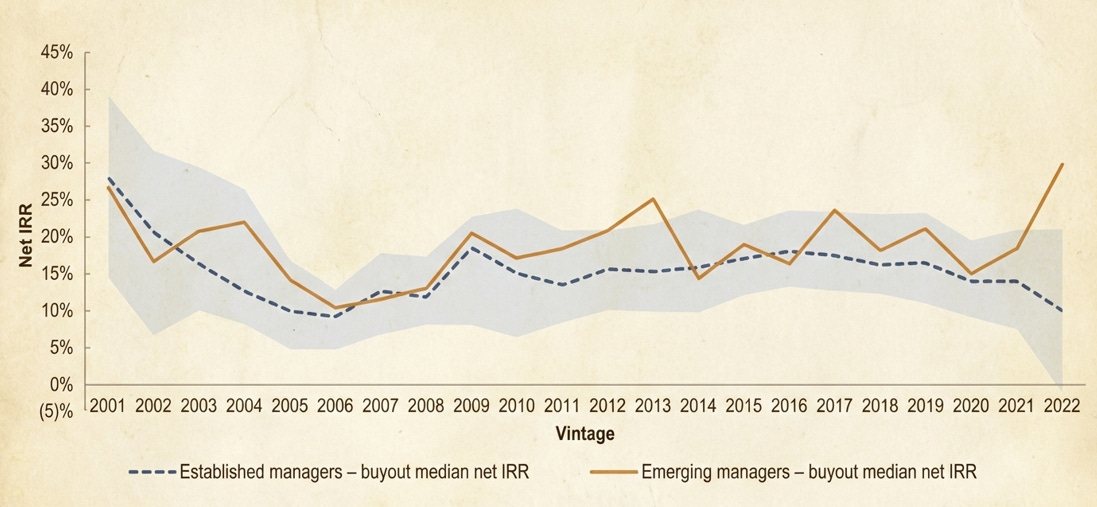
This outperformance is not surprising because delivering outsized returns is statistically easier to achieve with smaller funds. Despite that edge, fundraising has become more challenging over time. In the last 5 years, they raised just 3.3% of total capital, a decline from the 6.7% share they represented in the prior 15 years.
The primary driver is that larger LPs prefer allocating to established firms with multiple strategies and often have a $500m+ threshold for fund sizes. However, only ~32% of emerging managers ever target funds in excess of $500m. Their route likely lies through Funds of Funds specialized in smaller managers. These create a large-scale platform that satisfies LP thresholds, permitting them to deploy large amounts of capital at once.
Act Two
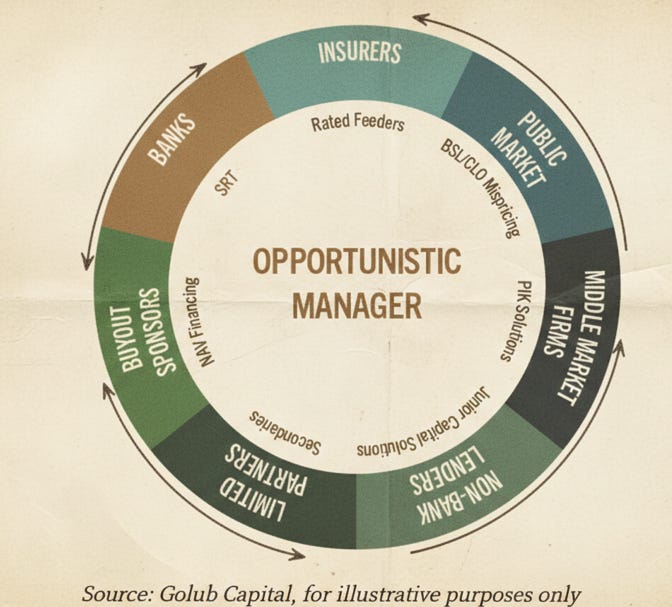
Finally, we are talking private credit, and specifically Opportunistic Credit, which has been gaining traction. In the report, it is covered twice: by Golub Capital and Capman Wealth. Both cover interesting opportunistic credit 101 ground, so I will combine their pieces.
First of all, opportunistic credit a unique beast that lives between senior debt and common equity. Their investment universe is quite broad and is illustrated in the chart below:
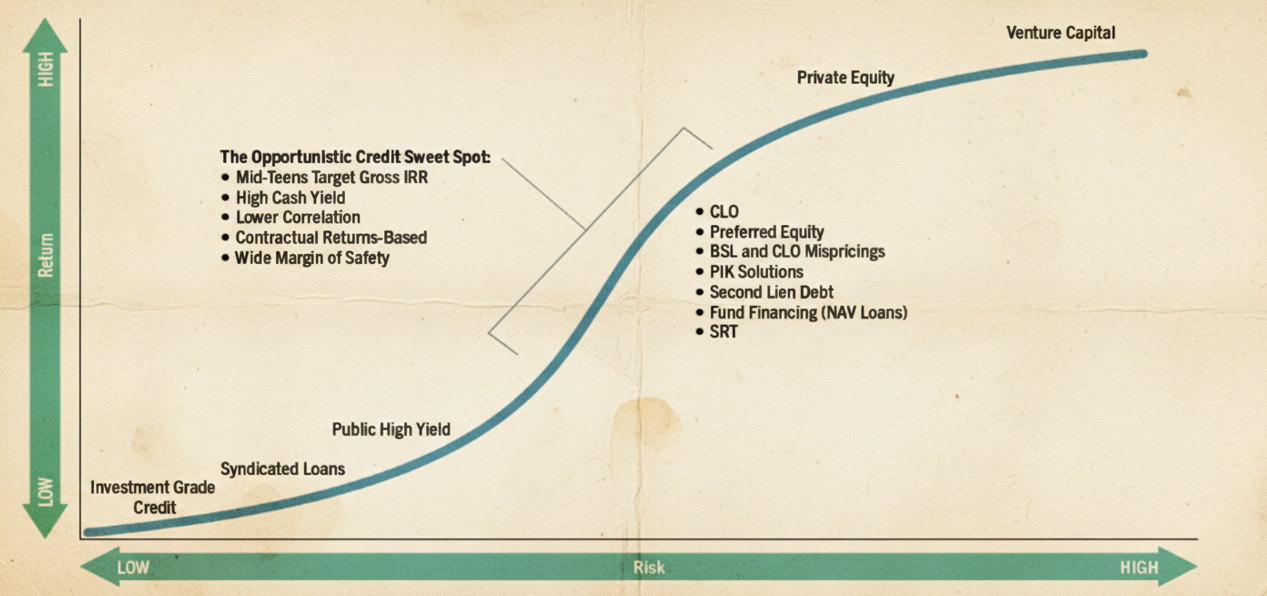
There is a perception that opportunistic credit is this event-driven strategy that is employed primarily during market dislocations. For example, COVID hits, the BSL market results in sell-downs, and opportunistic funds acquire performing loans for 80-90 cents on the dollar. Although it is accurate, due to the relative rarity of such market dislocations, opportunistic credit funds have adapted by providing creative solutions. For example, a fully levered PE-backed company that needs additional liquidity and senior lenders are not willing to upsize, can get a second-lien or preferred equity from these funds (obviously more expensive than traditional debt). The wider universe of the investment instruments and originating sources are in the chart below.
For LPs, opportunistic credit funds play an increasingly strategic role because they deliver returns across market cycles. As the paper suggests:
One of the key attractions is the ability to generate equity-like returns with a credit investor’s downside focus. In periods of market stress – when forced sellers, tightening liquidity or sector-specific issues create dislocations – opportunistic credit acts as a liquidity provider at the exact moment others are stepping back.
As such, during calm markets, it offers idiosyncratic, event-driven and uncorrelated returns. When facing volatile markets, it transforms into a counter-cyclical element in the portfolio.
Apparently, another interesting benefit is that for certain institutional LPs (e.g., insurers), is that opportunistic credit provides a regulatory-capital angle. Because it sits between credit and equity, LPs can classify it as either private equity or private credit.
Act Three
The last piece of the report is on Continuation Vehicle (CV) squared transactions from Kirkland & Ellis. Just a refresher: a CV is essentially a new fund created by a private equity firm (GP) to buy assets from their own older fund. A CV squared is a new vehicle buying assets from that previous CV… Yes, it’s complicated.
CV transactions started spreading in 2019 and were primarily focused on a private equity firm’s “trophy assets.” Since the typical CV term is five years, eventually these GPs started thinking about what’s next. Most of those initial CVs have performed well. However, exiting in the current environment to a third party or IPO is not ideal. Therefore, CV squared transactions are on the table. The piece provides a hypothetical:
The asset may have delivered a 2-3x return to the initial blind pool fund [typical fund] at the time of its exit as part of initial CV transaction. A further 2-3x return maybe achieved at the time GP considers a CV squared transaction, equating to an overall 4-9x multiple on GP’s initial investment.
Given the significant growth and expected continued expansion, K&E suggests that LPs should ensure the GP has a track record of executing at a larger scale before considering a CV squared transaction (as the company has clearly outgrown its typical target size).
Relative to traditional blind pool funds, the LP composition in CVs is typically far more concentrated. Transactions are often anchored by one or a small group of large secondaries LPs writing meaningful checks, with the remainder allocated to a smaller syndicate. Those anchor LPs usually form the backbone of the LP advisory committee (LPAC) and are directly involved in key aspects of the deal, including valuation and conflict approvals.
In standard CV transactions, GPs are generally expected to roll up to 100% of their economics from the selling fund into the new vehicle. Management is also typically expected to roll most of its equity. In a CV squared structure, however, rollover expectations often soften because the GP and management have gone for up to a decade without liquidity. The ultimate rollover amount is negotiated alongside other key terms to maintain alignment.
K&E concludes that CV squared transactions are likely to become a lasting feature of the market and does not dismiss the possibility of CV cubed structures emerging in the future.
There are another 20-25 pieces in the report that I did not cover, so if this topic interests you, it is worth reviewing the full report.
3. Software, Rebranded
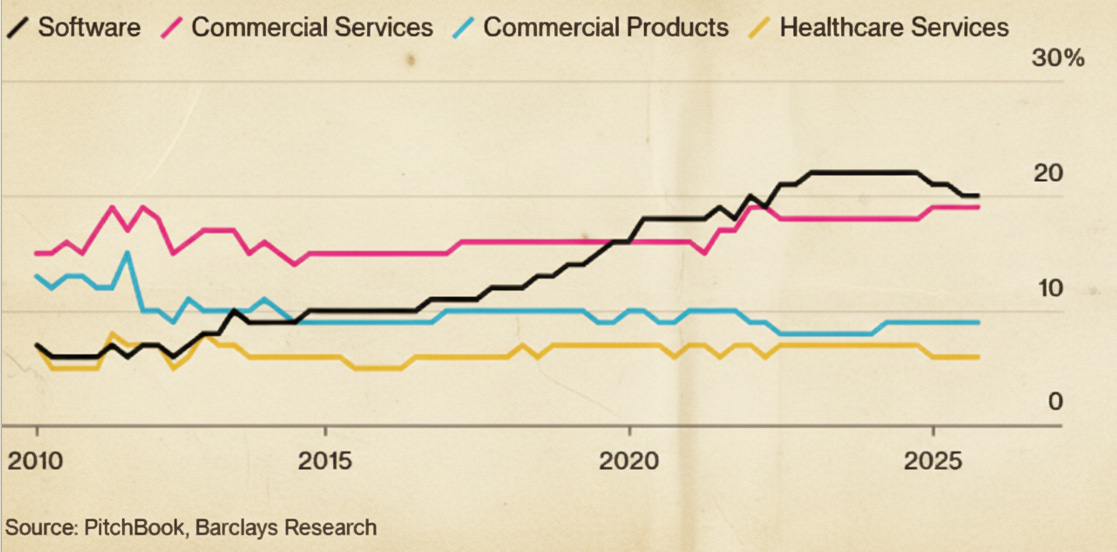
Let’s talk software, because it’s been too long… Bloomberg’s piece Private Credit’s Software Bet Is Even Bigger Than It Appears argues that private credit, specifically BDCs, are mislabeling loans to software companies by classifying them as anything but software.
Bloomberg reviewed disclosure documents of BDCs overseen by Sixth Street, Apollo, Ares, Blackstone, Blue Owl, Golub Capital and HPS. Across all of them, multiple companies considered software by at least one other lender were put in a different industry bucket.
At a time when software is the largest sector across BDC portfolios and is now under pressure due to AI-driven disruption, this is not a trivial detail. If investors cannot clearly see sector concentration, they cannot properly assess risk.
An analyst from Raymond James provided some context:
“The software classification in a BDC schedule of investments is only going to include generally industry agnostic software — it understates the exposure to it as a business model, and it’s not negligible. Software is a theme in its own right, and that classification scheme breaks down even if historically it was helpful.”
This whole situation feels like hindsight 20-20. I don’t think many people could have foreseen that software, as a broad category, could get hit simultaneously. The classifications put in place by each fund were not designed to mislead investors, but to reflect risk exposure.
If a software provider primarily serves the automobile industry, it will be affected by stress in autos. The same logic applies to real estate, energy, healthcare, and so on. Industry agnostic software, on the other hand, would historically have been vulnerable during a broad market downturn. That framework made sense until a couple of weeks ago. So it is somewhat odd to suddenly criticize BDCs for failing to anticipate a sudden structural shift that few predicted (well… I know many people expected AI to disrupt software, just not for the market to react this abruptly).
Still, fair point. If the exposure cannot be easily assessed, it should be addressed.
Where I disagree with the article is its framing around Sixth Street. Bloomberg opens with:
A quick scan of Pricefx’s website leaves little doubt how the company sees itself. “The #1 Leading Pricing Software” is splashed across its homepage. As is “Great Pricing Software Makes Dreams Reality.” In all, “software” appears more than a dozen times on that first screen alone. One of Pricefx’s biggest financial backers prefers a different label, though. Sixth Street Partners, a top direct lender to the firm, classifies Pricefx not as software but as a “business services” company.
Unlike other BDCs, Sixth Street does not present software as a standalone category. As disclosed in its filings, companies are grouped by end market (below).
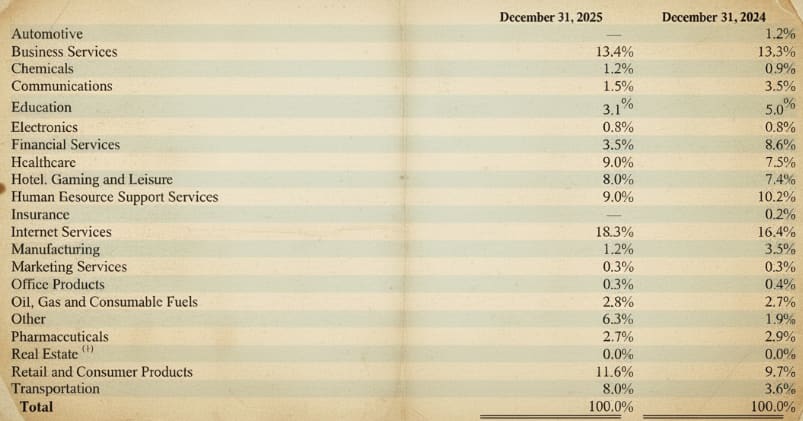
The article itself acknowledges this:
In filings, Sixth Street says it groups companies by end-market, meaning software isn’t shown as a standalone category, even as it acknowledges that “many of our portfolio companies principally provide software products or services, which exposes us to downturns in that sector.”
If you look at Sixth Street’s filings, their exposure to software is referenced multiple times, and the line Bloomberg quoted comes directly from the Key Risks section. Even if an investor overlooked that disclosure, the repeated appearance of “software” in portfolio company names should signal clear exposure and prompt a closer read of the risk factors. That review would lead them straight back to the Key Risks section.
The Blue Owl example, however, is more difficult to defend.
At least four companies in Blue Owl’s largest publicly traded BDC, Blue Owl Capital Corp, are classified under categories including “chemicals,” “infrastructure and environmental services” and “business services,” yet are labeled as “software” in its technology-focused fund, Blue Owl Technology Finance Corp.
Well, look, that’s different. It is one thing for separate firms to categorize the same company differently. It is quite another for the same firm to classify the same company under different industries across its own funds. That kind of inconsistency raises legitimate questions about how exposure is tracked, aggregated, and managed from a risk perspective internally.
All BDCs mentioned in the article declined to comment, except for Blue Owl. Let’s see how they responded.
“Our job as a manager is to provide information in a consistent way so investors understand the risk that they are taking,” a spokesperson for Blue Owl said. “Each of our funds has a different investment strategy, so the industry classifications can differ.”
Yeah, this spokesperson did not help the cause at all. Honestly, it would have been smarter to skip the comment and focus on fixing the inconsistencies internally.
In Round #19 on Nov. 26th, when discussing Blue Owl’s failed BDC merger and the subsequent reports that a combination was still being considered, I wrote:
I am not a PR expert, but at this point it might be smart for Blue Owl to stay quiet for a while. They are making their own investors nervous and they are stirring up more noise in the market than necessary.
When I said “for a while,” I did not mean two months. Seriously. Just STOP TALKING. And if you don’t, it is your Co-CEO’s who pledged $1.9B in stock, who may find themselves staring at a margin call.
4. Private Credit’s Quiet Creep
Lincoln International published its Q4’25 Private Market report, which has been a go-to for media that covers private credit.
On the PE front, things looked positive. EV grew 9.9% in 2025 driven by EBITDA growth, while multiples remained relatively flat. That compares to 15.6% and 11.9% for the S&P 500 and the S&P 493 (ex. Mag7), respectively. Not bad. That said, that growth slowed down each quarter: 6.5% in Q2, 5.2% in Q3, and 4.7% in Q4.
Private Credit is mixed… Well, mostly negative.
While the covenant default rate remained flat since Q3 at 3.2%, amendment activity increased 13% quarter-over-quarter, with maturity extension and covenant holiday activity increasing 14% and sponsor infusion activity increasing 31%.
I like flat covenant defaults, but surely that uptick in amendments and covenant holidays is the reason defaults stayed muted. Sponsor infusion, though, is great news because they still need to see value in borrowers beyond the debt value to put any money in.
Lincoln points out that 11% of loans they value paid PIK in 2025, up from 7% in 2021. The media keeps quoting this statistic, but I think comparing to 2021 should be punishable by an “add context” ankle monitor. Yeah, who would have thought that fewer companies would rely on PIK in 2021 when interest was 0.25% than in 2025 when interest was coming off 5.0%, right?
That said, there is another statistic in the report on "Bad PIK" that is also being quoted quite often, and it went up from 6.1% in Q3'25 to 6.4% in Q4'25. Lincoln believes that Bad PIK is a proxy for actual defaults, because borrowers/lenders negotiate PIK as part of their amendments to avoid defaults. I think it's a fair argument, which is hard to disprove.
One positive development:
Throughout 2025 size-weighted fixed charge coverage ratios increased from 1.1x to 1.3x and the weighted average percentage of companies with a fixed charge coverage ratio of less than 1.0x decreased to 21%, which is the lowest level since 2022.
Certainly, the 75bps rate reduction and that EBITDA growth discussed above contributed to this dynamic. You know what else contributed? Those PIK loans that reduce the debt service. We don’t have granular data to figure out the primary driver, though.
I am looking forward to their Q1’26 report, which I think will look pretty bad!
5. “Limping” Through Distress
Andrew Milgram of Marblegate Asset Management doesn’t give many interviews, but when he does, I listen. He recently appeared on the FICC Focus podcast, a show that rarely disappoints and only got better with Andrew on the mic.
You can find the full episode at this LINK. A few tidbits follow:
On the origin of Marblegate:
During the 2008 financial crisis, the founders identified an opportunity to build a distressed firm focused on under-served middle-market companies, a segment representing roughly one-third of US GDP and more than 75% of bankruptcies over time, yet often overlooked by larger credit and distressed managers that had scaled alongside private equity. At the same time, the market was bifurcating between a trading-oriented, “illiquid stock market” model, which still dominates today, and the emerging illiquid direct lending model that accelerated after the 2010 leveraged lending guidelines from the FDIC, OCC, and Federal Reserve. Against this backdrop, they launched Marblegate with $50m in AUM, growing it to approximately $3B today.
On credit documents:
The core challenge, as framed by Marblegate, is that “they invest in companies, but we buy documents.” In the BSL, loans may be labeled secured, but in practice they often function like unsecured credit and tend to be at least under-secured in restructurings, making documentation difficult to rely on. Private credit offers marginally stronger documents, but as substitution between private credit and the broadly syndicated market increases, pricing and documentation standards are converging, which may erode those protections. By contrast, banks still maintain relatively stronger covenants, though lighter than in the past, and are subject to twice-yearly regulatory examinations that directly affect their cost of capital and behavior. Ultimately, all credit participants respond to incentives, echoing Charlie Munger’s idea that outcomes follow from incentives.
On the shift in credit work:
He argues that parts of today’s credit market rely on technology and structural features, similar to the CLO model’s dependence on over-collateralization and diversification, as a substitute for deep, fundamental credit work. That approach may appear efficient but can compound negatively over time and ultimately expose investors. In distressed and restructuring situations, outcomes remain highly bespoke and require intensive analysis of documentation, capital structure, and business fundamentals, along with creative application of legal rights. He also contends that restructuring has increasingly shifted corporate credit away from serving operating enterprises toward a meta-market dynamic that prioritizes positioning among lenders and advisors. The recent productization of liability management exercises, in his view, has often harmed the underlying businesses at the center of these transactions.
On middle-market distress:
Looking at annual data over the past several years, he notes a steady deterioration in middle-market credit quality, with declining earnings power and sharply higher leverage. Most concerning, roughly 20% of companies each year have had a debt service coverage ratio below 1.0x, meaning they cannot cover their interest obligations. Based on that data, an increase in bankruptcies was inevitable, and that pickup has already begun, with further reorganization activity likely ahead.
On distressed investor selection:
He notes that distressed investing is ultimately shaped by experience. Over time, investors accumulate hard-earned lessons, and in his view, allocators should back managers who have “walked with a limp”, meaning they have endured real losses and learned from them. Having suffered through credit mistakes sharpens judgment, clarifies where risks truly lie, and instills the necessary discipline and constructive paranoia required to navigate complex distressed situations.
Overall, this is a great episode. It is about an hour long, but there are pre- and post-discussions (which are also interesting) that make the total runtime look like an hour and 40 minutes. Just keep that in mind.
6. Deals on the Block
(click active links for additional details; AND you can now download an Excel file with ALL prior deals)
Lender: Goldman, Ares, Blue Owl, Antares, Apollo
Borrower: Clearwater Analytics
Sponsor: Permira & Warburg Pincus
Facility: $3.5B
Pricing: SOFR + 4.50%
Purpose: Finance $8.4B LBO
Lender: Blue Owl, Goldman, Golub, HPS, Blackstone
Borrower: OneStream
Sponsor: HG, General Atlantic, Tidemark
Facility: $2.3B ($1.5B Term Loan and $850m DDTL)
Pricing: SOFR + 4.75%
Purpose: Finance $6.4B $LBO
Borrower: Canada Nickel
Sponsor: N/A - Public
Facility: $32m Term Loan
Pricing: 12% All-in
Discount: 97.5 cents on the dollar
Purpose: Refinance
Other: At closing, Auramet received 1,750,000 1-year warrants at an exercise price of CAD $2.03 (current price: CAD $1.95)
Just to be clear: more deals surfaced, but I only flagged ones with details beyond size (pricing, attachment, etc.). If you catch wind of more, send them over - anonymity guaranteed.
7. Bulletin Board
Shortcut.AI, an AI tool for Excel that lets you build models by simply typing requests (similar to ChatGPT). It is free to use up to a certain number of tasks per day (LINK). If you hit your limit before finishing your project, simply upgrade to the Pro plan ($20/month) and enter promo code DEBTSERIOUS (all capital letters) to get 50% off.
LoanEdge, a BDC research tool that lets you look into BDC loan compositions, individual loans, which BDCs own a specific loan, and more is kindly providing DEBT SERIOUS readers with a free 3‑month trial (the regular price is ~$3k per year, and it’s higher for institutions). Here is a LINK to the tool. Send an email to Sadaf Khan at sadaf@theloanedge.com and let her know you are from the DEBT SERIOUS community.
Financial Times subscription at 40% discount (LINK). Full disclosure: I am not a fan of their private credit coverage, but if you decide to subscribe, you might as well use the discount, which lowers the price to $375 per year.
As a reminder, I don’t personally benefit from either of these offers. I am just saving you money.
Lastly, our community is nearly 2,000 strong and includes a broad cross-section of mid- to senior-level professionals across private credit, private equity, LPs, and debt advisory. Please use the Bulletin Board at the end of each weekly letter to share events, discounts, or deals that benefit the community. I will continue to feature these opportunities and personally connect interested parties at no cost.
That’s the bell — round over. See you in the next.
Aznaur
Aznaur.Midov@KierLior.com