
Round #24: Anatomy: Proceed With Caution
PEs & 31,000 Portcos; Proceed With Caution?; SVB and CLOs; Most Important Chart; The ECB on SRTs; Private Credit Market Size; Surprising Driver of Auto Loan Delinquencies; Deals!

In Round #24: PEs are sitting on 31,000 portcos; When to Proceed with caution…; Most popular pieces of 2025; The most important chart; The ECB is worried about SRTs; Private Credit market size; Drivers of auto loan delinquencies; Notable deals!
Happy New Year to you and your families!
You got a Christmas gift last week, and here is the New Year’s gift. If you have PayPal, you can get Perplexity Pro free for 12 months (normally $20/month).
Here is the LINK. It looks like the offer is valid through Dec 31 (!!!), so hopefully you opened this email on the day you received it.
This is not sponsored. I just wanted to share it with you so I can honestly say I make my subscribers money.
1. Stuck at Exit
Alright debtageeks, what stage of the cycle are we in if The New York Times suddenly decides to publish a genuinely solid piece on private equity? Yes, the headline is dramatic and clicky, but the substance is actually good, which makes it forgivable. Once Wall Street’s High Flyer, Private Equity Loses Its Luster (Link) discusses PE’s 4-year underperformance versus the S&P 500 (5.8% vs 11.6% CAGR), 2025 M&A failing to live up to optimism coming out of 2024, and the industry sitting on a massive backlog of portcos waiting for an exit window that refuses to open.
The backlog is probably the most interesting part.
Even with interest rates falling and the number of initial public offerings increasing in recent months, it has not made a dent in the industry’s backlog of at least 31,000 companies valued at $3.7 trillion, according to research from Bain & Company. That amount exceeds last year’s record of 29,000 companies valued at $3.6 trillion.
That is a lot of companies that need to be sold! We’ll come back to that in a minute.
Now, regarding PE performance. To be fair, PEs don’t have exposure to the Mag 7, which have driven a disproportionate share of S&P 500 returns over the past few years. Adjust for that concentration and, based on a rough back-of-the-napkin calculation, PE has performed broadly in line with the S&P 493 over the same period. If you work in PE, you can make this point to LPs. I mean, it won’t work, but it might buy you some time to think of a better excuse.
On M&A, 2025 has been weaker than people expected, but mostly in the first half of the year. Q3 was actually the strongest quarter since 2022 on an acquisition value basis, even if deal count stayed weak. When people were calling for a 2025 rebound at the end of last year, they were clearly not factoring in a tariff war, issues involving Iran and Venezuela, immigration uncertainty, or all the noise around Fed independence. Given all that, M&A and markets have honestly surprised me.
Back to the 31k portcos. Many of these assets were acquired post-COVID at aggressive entry multiples, and selling them today would lock in weak realized returns. That is a pricing issue. It is still far better than being forced to sell and finding no exit market. But this cannot drag on much longer.
Capital is not the constraint. PE firms are sitting on roughly $2.2T of dry powder, and private credit has another $540B+ ready to deploy. Financing capacity exists. Structuring flexibility exists. What the market lacks right now are sellers willing to move on price.

Let’s hope nothing crazy happens over the next year, so the portco backlog starts moving, deals get done, and lenders have something worth financing.
2. Anatomy: Proceed With Caution
Fairly recently, I came to a realization about a bias I’ve carried toward market expert views for most of my professional life. Better late than never, I guess. As a student of financial markets, you learn early on that public euphoria leads to bubbles, and bubbles end in crashes. That training made me deeply skeptical of very bullish calls, especially when they are not well articulated or backed by hard data.
At the same time, if I read a measured report that walks through rising unemployment, softening consumer sentiment, or other depressing statistics and then concludes with something like “Proceed with caution,” I instinctively treat the author as a trustworthy expert. Someone who has been through cycles, seen things break, and whose opinion therefore deserves respect.
What I eventually realized, somewhat uncomfortably, is that “proceed with caution” is almost useless as guidance. It sounds wise, but it tells you nothing.
That realization came from asking a basic question: is there ever a time when you do not proceed with caution? I have never heard a CEO say, “Now is the time to go nuts. No diligence. No covenants. No pricing. Just bring me deals.” You are always cautious. In my experience, deals are underwritten one at a time, spending an inordinate amount of time discussing risks that have a tiny chance of materializing, but you still underwrite to them because they can theoretically occur.
Caution, however, does not mean the same thing in every part of the cycle. Near market peaks, caution reflects the belief that the music will eventually stop. After crashes, it reflects fear of a double dip, usually driven by fresh “PTSD” from the last one. In between…well, “in between” is hard to define. There is always a steady stream of negative information that makes it feel like something is about to break. You can probably identify the middle of the cycle only in hindsight, not while living through it.
This dynamic is visible today. Over the past two years, the media has been counting every decimal point increase in defaults, every uptick in bankruptcies, and every mention of “bad PIK.” There is a growing group of commentators warning about the dangers of private credit, some calling it “garbage lending.” Economists point to tariff uncertainty, rising unemployment, auto loan delinquencies, and the K-shaped economy.
At the same time, there are clearly constructive forces at work. Interest rate cuts. What feels like semi QE from the Fed. An awakening in M&A markets. Significant private equity and private credit dry powder ready to be deployed, as discussed in the prior piece.
So, what do we make of all this?
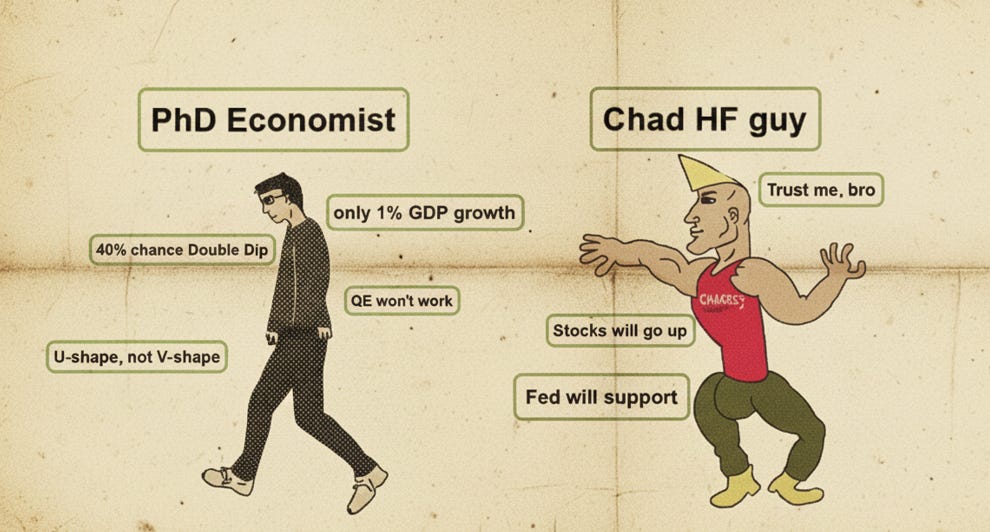
This tension reminded me of three interviews from September 2010. Two economists who correctly warned ahead of the 2008 financial crisis, and one hedge fund manager who lost money in 2008 but made a killing in 2009.
Nouriel Roubini, Economist (Link):
Roubini argued that crises are white swans, not black swans. They are predictable based on available data. His outlook at the time was bleak. He expected a “slow, below trend recovery across advanced economies, closer to a U-shape than a V-shape.” Central to his view was weak GDP growth, which he expected to run around 1% and feel recession-like. He pointed to fading fiscal stimulus, poor consumer confidence, and soft retail sales. He assigned a 40% probability to a double dip recession in the US, argued that QE would be less effective than in the past, and ultimately expected markets to fall by roughly 20%. It was a dense, data-driven, and very convincing argument.
David Rosenberg, Economist (Link):
Rosenberg’s framework was similarly cautious. He questioned the effectiveness of QE, noting that the first round had failed to generate a durable recovery. He highlighted an unemployment rate of around 10% and GDP growth running at roughly 1%. He questioned how anyone could believe a sustained recovery was underway when indicators like housing activity and consumer sentiment were still sitting at levels historically associated with recessions. He concluded that if you have conviction in the rally, you can put your money to work, but at your own risk.
Again, it was difficult to argue against those points, and anyone who respected his views would likely hesitate to put money to work.
Then there was David Tepper of Appaloosa Management. He went on CNBC and said the following (Link):
“What did the Fed just tell us? They said we want economic growth and we don’t even care if there is a little inflation, which they never say. So, there are two scenarios: either the economy is going to get better by itself in the next three months, in which case stocks will do well; or the economy is not going to get better in the next three months, and the Fed will come in with a QE, in which case every asset will do well.”
That was the entire thesis. No charts. No data points. No historical references. Nothing. Was it convincing at the time? No!!! Are you kidding?! He sounded like a degenerate crypto bro with laser eyes, circa 2021.
And yet, Tepper was the one who turned out to be right.
Roubini and Rosenberg identified real weaknesses and structural issues, and some of their concerns did materialize. What they missed, though, was the dominant variable in that moment: the Fed’s willingness to do whatever it took. All three spoke within days of one another, with access to essentially the same information. Rosenberg’s piece was even a response to Tepper, and Roubini reiterated his stance two months later.
The lesson is not that data is useless or that economists are unreliable. It is that bearish, data-heavy arguments tend to sound more convincing than they deserve to be.
So what actually matters for private credit heading into 2026, in my opinion?
M&A matters. Not just large deals, but activity across the full spectrum. More deal flow allows capital to be deployed without lenders racing to the bottom chasing a limited set of opportunities.
Fed policy matters. Over the past 18 months, rates have been cut by roughly 1.75%, including 0.75% towards the end of 2025. That meaningfully improves cash flow for stressed borrowers and supports valuations, and subsequently loan LTV. You’d be amazed what a 1% rate reduction does to the right DCF model. The Fed is projecting at least one additional cut in 2026, and expectations are now anchored.
Equity markets matter. An equity market drawdown would stall M&A and hit the higher-income segment of consumers that has been carrying spending. That risk exists. At the same time, this market has been driven by AI-related activity. Given how strategic AI has become for Big Tech and governments alike, with companies clearly willing to spend aggressively, there is reason to believe capital may continue flowing there despite stretched valuations.
Smaller banks matter. Large banks and major alternative managers will be fine. The pressure points are smaller banks exposed to the lower end of the K-shaped economy and second-tier alternative managers, along with their insurance counterparts. While small, these banks can trigger panic that gets projected onto the entire banking sector.
As for “shadow defaults,” rising bankruptcies, or private credit taking over borrowers, much of that feels like clickbait. Yes, underwriting standards are deteriorating and pricing is compressing. But that is exactly what you would expect when an asset class delivering equity-like returns in the most senior tranche of the capital structure inevitably draws in competition.
All that said, whatever you decide to do, Proceed With Caution…
3. Unoriginal, Me
Several “Year in Review” newsletters landed in my inbox from fellow Substackers, and being the unoriginal person I am, I figured this was a good excuse to share the most popular pieces published here in 2025 (this will be short, don’t worry). Below are the two pieces that were most often passed along by readers.
Writing: The Rise and Fall of Silicon Valley Bank
This Round was unique because it only contained one essay, written for the anniversary of the founding of Silicon Valley Bank. It walks through the bank’s story from the beginning through the collapse, but from an angle that was not discussed in the media (which is why I wrote it). You’ll likely learn something new.

Podcast: Mike Kao of Akanthos Capital on CLOs, NYSE:ECC, & Private Credit
CLOs are outside my circle of competence, so you don’t see them discussed much here. For that reason, I recorded an episode with Michael Kao, who has previously called out the media for mischaracterizing CLO risks. This episode is packed with insights on CLOs and one of Michael’s investments, which serves as a useful primer. I learned a lot from the conversation.

4. Best Chart Ever
Well, maybe not ever, but it’s the only chart I have saved on my desktop because it answers some very interesting questions about private credit.
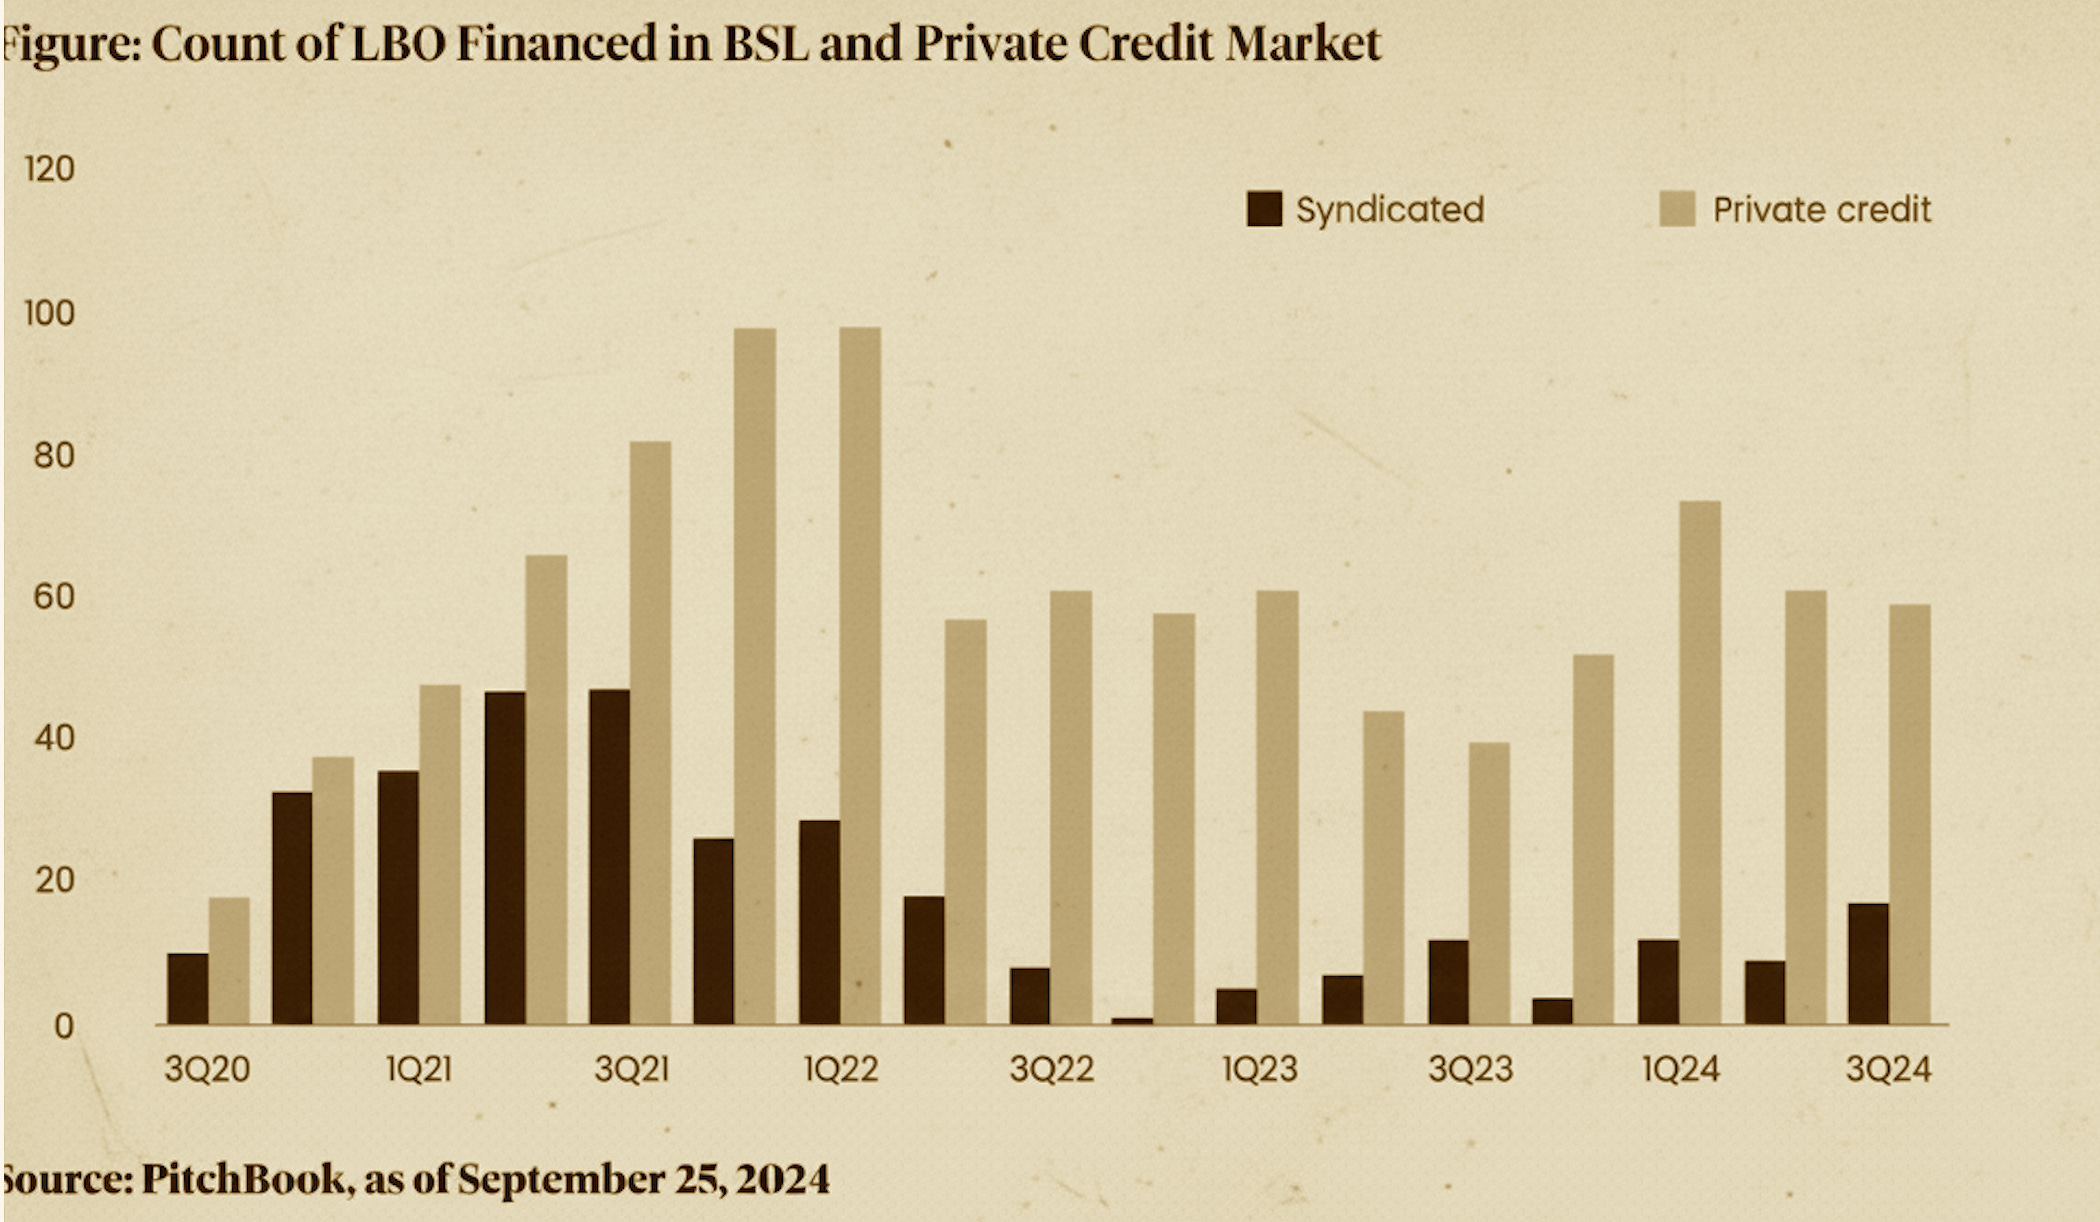
We know why investors have been choosing private credit: smooth, “equity-like returns via investments in the most senior tranche of the capital stack,” as we said above. But the chart answers a different question, namely why the customers, in this case private equity funds, have been choosing private credit. The answer is consistency relative to alternatives.
Look at how BSL has been pulling out of the market in certain quarters (COVID, interest rate hikes, etc.), while private credit has almost been filling the gap. If you are a sponsor, one thing you value more than pricing and looser structure is confidence that the funding will be there on the day of the scheduled transaction close. It turns out banks weren’t always there. Now, this doesn’t mean that the sponsor is not going to refinance the loan with banks when the storm passes at lower pricing or with looser structure (and when a new loan is favorable despite early termination fees… long story… but I wanted to note this for those who know).
Private credit is great for markets for the very same reason. As you know, one of the reasons why financial crises get worse and take time to recover is that capital becomes scarce, as lenders pull back. Now you have an alternative to banks that is more than happy to fill the gap, softening the blow. Although the chart focuses on LBOs and many companies that need capital are not PE-owned, this chart can be used as a proxy for direct deals as well. And private credit is increasingly moving to “sponsorless” deals due to premium pricing and favorable documentation (no LMEs!), often building alliances with banks themselves.
5. Return Label Included
It’s been a while since we discussed SRTs, or Significant Risk Transfers in this case (sometimes the more narrow meaning of Synthetic Risk Transfer is abbreviated as SRT).
The Financial Times discusses how the ECB warned European banks against overusing SRTs to reduce regulatory capital requirements (Link). If that sentence made no sense at all, you should revisit my earlier post explaining what SRTs are and how they work.

And if you really want to spend the holidays going deep on SRTs, Les Barclays has a longer post covering the topic in more detail HERE.
The reason the ECB is paying attention is that SRT usage has grown aggressively across European banks. The chart below shows annual issuance through 2024, and activity in the first half of 2025 alone was up 85%!
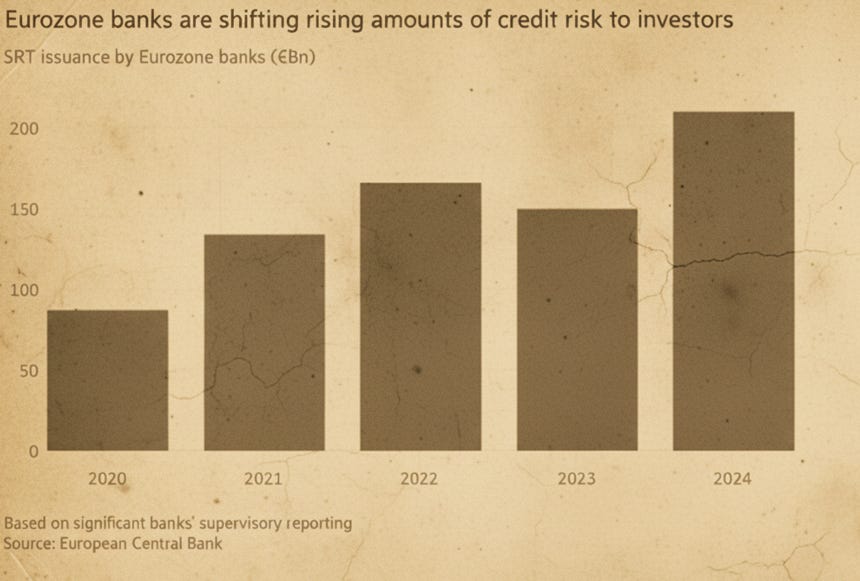
FT reports:
Activity has accelerated this year as banks try to offset the impact of higher capital requirements stemming from the EU’s introduction earlier this year of stricter rules agreed by global regulators at the Basel Committee on Banking Supervision.
The ECB’s concern is that banks may appear de-risked on paper, while “the risk is not really transferred but comes back to the banking sector in times of stress.”
There are two main ways this can happen. As I am typing it, I am realizing that in order to proceed, I can’t assume you will read the links above, so I need to explain at a high level what an SRT is. I will extremely oversimplify it though.
In a nutshell, an SRT allows banks to offload some of the risk of their loan portfolios. For example, assume Bank of America (BofA) holds $100B of risky leveraged loans. Through an SRT transaction with Berkshire Hathaway (BRK) it insures $37.5B of that exposure ($25B plus $12.5B in the chart below). This means that if $40B of this leveraged loan portfolio goes to zero, BofA will only write off $2.5B, and BRK will take the $37.5B loss. As with insurance, BofA pays BRK monthly premiums. SRTs like this are typically structured with maturities of around 3 to 5 years.
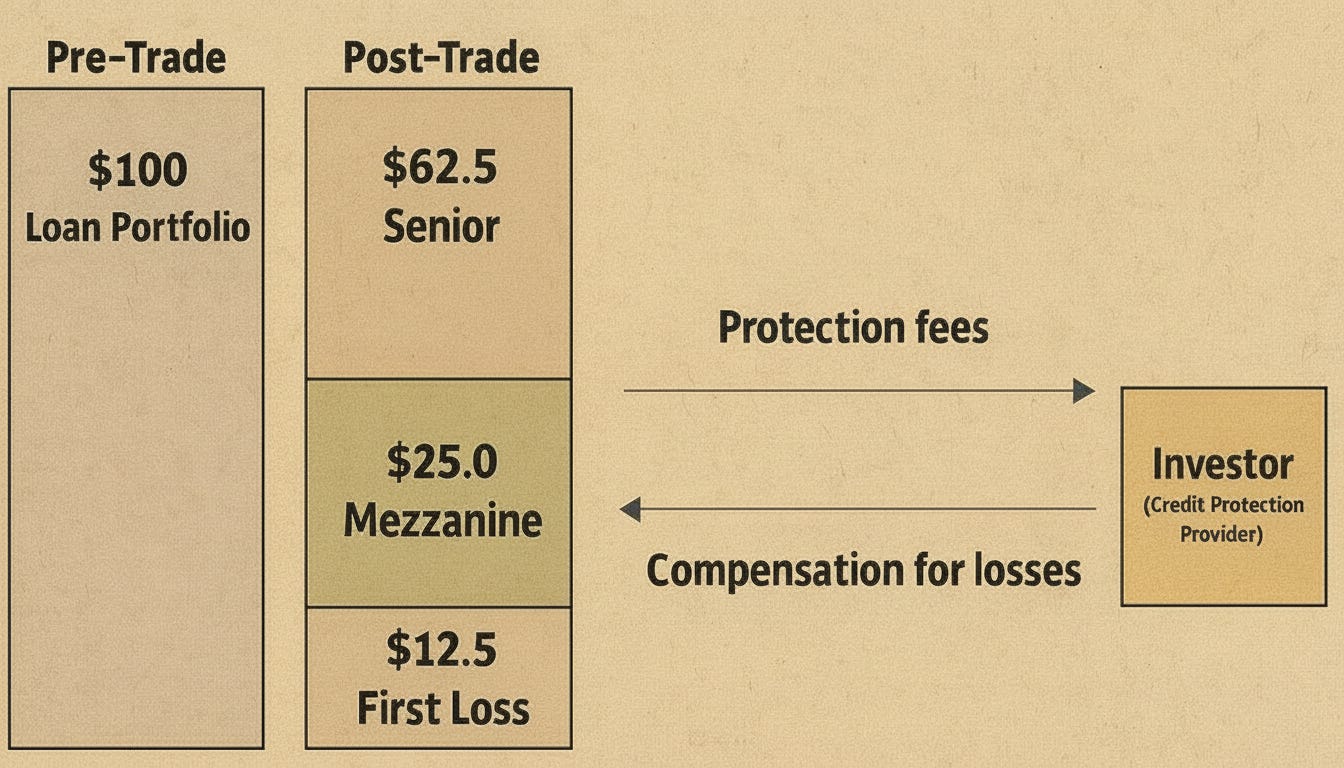
This is a great risk-management mechanism, but regulators worried about two scenarios also covered in a recent Bloomberg piece (Link):
If at year 5 the credit market deteriorates, BRK decides not to renew the SRT, and no one in the market is willing to take that risk, BofA will get those risky loans back. If the same $40B of leveraged loans were to go to zero, BofA would take the full $40B loss. There is also a scenario where BofA optimized its regulatory ratios under the assumption that it would roll this exposure for another 5 years, and if it is required to take it back, BofA’s risk-weighted assets could suddenly exceed regulatory requirements.
The second scenario needs a bit of background. BRK is an investment-grade company, so the SRT in this example can be executed via a simple agreement or CDS because counterparty risk is low. More often, counterparties are hedge funds, private credit firms, or other institutional investors without BRK’s balance sheet strength. In those cases, they are not just signing an SRT. They need to post collateral. Practically, that means placing $37.5B with a custodian bank, such as BNY Mellon. If $40B of loans go to zero, BNY Mellon transfers $37.5B to BofA, and BofA’s loss is again limited to $2.5B.
Here is where the structure starts to break down, and I will use an extreme case here. Let’s use “MarginCall Capital” as a hypothetical fund entering into an SRT with BofA.
MarginCall believes the loans are not actually that risky, and that the insurance premium it charges BofA will more than cover potential losses. The problem is that MarginCall does not have $37.5B sitting around to post as collateral. So where does the money come from? BofA lends the money to MarginCall, which then deposits it with the custodian bank as required collateral. It starts to look a lot like those OpenAI-style circular transactions.
So what happens when $40B of leveraged loans go to zero? Well, BofA gets the $37.5B it loaned to MarginCall, which sits at BNY Mellon, back. But it is BofA’s own capital, so BofA essentially insured itself, which all sounds pretty dumb right about now, doesn’t it?
Again, this is an extreme example, and it is hard to come up with data on how many banks have entered these types of transactions. But MarginCall doesn’t even need to borrow from BofA to have regulators nervous. Borrowing from Citi to enter into BofA’s SRT, for example, also keeps the risk in the system, which is what regulators do not appreciate.
That is why the ECB is now stepping in and signaling heightened scrutiny. They are no longer comfortable treating all SRTs as genuine risk transfers.
6. Sizing Things Up
Remember how a couple of weeks ago we disagreed with Apollo on the size of the private credit market? It looks like Fitch overheard the dispute and basically went, “hey boys, don’t fight, here is the actual size and growth forecast.” So, it’s roughly $2.2T (sorry, Apollo).
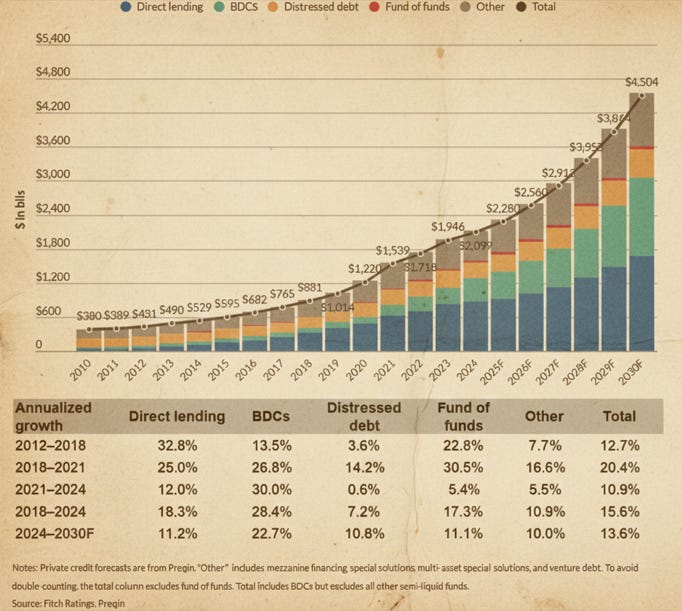
Frankly, I don’t think there is a perfect definition, and the chart reflects one way the total is being measured, so here are a few thoughts:
I am not sure why they include funds of funds in their definition of private credit. I mean, those funds invest in actual private credit funds, the ones that originate loans, negotiate credit agreements, and get called out when their loans go to zero. The notes section of the chart suggests that funds of funds are excluded from the total, so they basically agree, but for some reason still show them as a different category. It’s fine, just odd.
Distressed debt funds sometimes invest in BSL (which is the opposite of private credit), so although I am not advocating adjusting for it, it is something to keep in mind.
I am not sure if asset-based financing is part of the “Other” category (sometimes it’s included in “Special Situations”), but I am sure it will soon start appearing as a standalone category given how aggressively private credit firms are expanding into it (Ares and KKR come to mind).
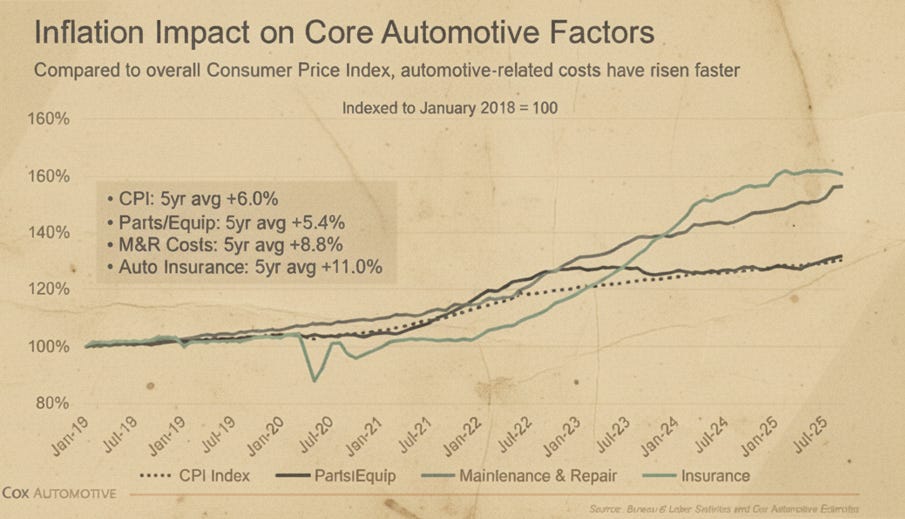
7. Consumer Blind Spot
This piece was discussed on Bloomberg the other day, and I found it interesting. The conversation focused on what is driving the rise in auto loan delinquencies, and one underappreciated factor is auto insurance, which has become far less predictable than loan payments themselves. While borrowers can usually budget for high vehicle prices and interest rates, insurance costs have been delivering sustained sticker shock. Auto insurance inflation has been running well ahead of both CPI and broader auto costs, helping explain why some consumers misjudge affordability and ultimately fall delinquent.
8. Deals on the Block
(click active links for additional details; AND you can now download an Excel file of ALL 4Q25 deals)
Borrower: J.Jill
Sponsor: N/A - Public
Facility: $75m Term Loan
Pricing: SOFR + 5.50% (5.25% post 6/30/26)
Discount: 99 cents
Tenor: 5 years
Purpose: Refinance Jefferies’ facility
Borrower: KIK Custom Products
Sponsor: Centerbridge
Facility: $150m Term Loan
Pricing: SOFR + 5.50%
PIK option for the first 2 years at SOFR + 7.50%
Tenor: 3 years
Purpose: Cover a liquidity shortfall
Borrower: The Children’s Place
Sponsor: N/A - Public
Facility: $100m Term Loan
Pricing: SOFR + 5.25% (grid pricing post 6/16/26)
Tenor: 5 years
Purpose: Partial pay down of Wells Fargo’s ABL facility
Just to be clear: more deals surfaced, but I only flagged ones with details beyond size (pricing, attachment, etc.). If you catch wind of more, send them over - anonymity guaranteed.
That’s the bell — round over. See you in the next.
Aznaur
Aznaur.Midov@KierLior.com
I'm not saying that private credit doesn't have its risks/problems/whatever, but at a price lots of not so great things can be attractive investments, while some fabulous businesses can be risky. I've owned WMT for 20 years and can't tell you how much I respect the company. However, just in the last year, where any changes to the underlying business have been minor, it's 52 week range is 80 to 117 (currently 111). Just two years ago it traded at 52. Current 40x earnings for a company in which the needle is really hard to move in a big way seems vey rich. I call that price risk.
I would pay attention to publicly traded BDCs. You noted an Oaktree loan in this post. Just to point out a few facts: Their publicly traded BDC (OCSL) has indeed suffered from poor performance. NAV is down about 25% from 12/31/21 to 9/30/25 (ouch). But its price from the same starting point until today is down 43%. You can certainly make a case that even the latter drop isn't enough if you don't believe their marks or think management has lost its touch permanently or you're afraid credit contagion will make these numbers moot. It's true that if liquidity dries up and suddenly there are forced sellers (I was involved intimately in '07-'09), then in the short run there can be eye popping drops.
Best to you in '26.
For me, this was the most productive read in a long long time.